Code optimization can sometimes be experienced as a lengthy process, with disruptive effects on code readability and maintainability. For effective optimization, it is crucial to focus efforts on areas where minimal work and minimal changes will have to most impact, ie. go for the jugular
The Prey
I will illustrate this using SamplingProfiler [1] in a small example, taken from a small library that deals with short vectors of varying length (but usually less than 10 dimensions), which I simplified, isolated & anonymized for the purpose of this article.
uses TypInfo;

type
   TDoWhat = (dwInc, dwDec);

procedure DoSomething1(var data : array of Integer; what : TDoWhat);
var
   i : Integer;
begin
   for i:=Low(data) to High(data) do
   begin
      case what of
         dwInc : Inc(data[i]);
         dwDec : Dec(data[i]);
      else
         raise Exception.Create('Unsupported: '+GetEnumName(TypeInfo(TDoWhat), Integer(what)));
      end;
   end;
end;
Get Meat into Belly
Before starting any kind of optimization, one has to define goals and limits, ie. figure out what “good enough” will be rather consider “good enough” to be the state of the code one has grown tired of optimizing it!
The sample code above is quite straightforward and simple. It would of course be possible to blow this code to huge proportions for optimization’s sake. If you are after getting every last drop of CPU-cycle juice, and allow yourself to use every trick in the book, a fully optimized version could represent several thousandths of lines of code (I’m not exaggerating). If it’s your core business, it might be okay, but if it’s just a utility library, the increased maintainability issues could never be justified.
But since this article is intended more as an illustration than a discussion on the methodology, I’ll get straight to the buffalo (beef). For further reading on that subject, you can start from Big O Notation [2], Benchmarking [3] and Software metrics [4] articles in wikipedia, there are also whole books [5] on the subject.
Stalking the Prey
Looking at the above code, the first obvious optimization that developers suggest seems to be taking the conditional out of the loop, resulting in several case-specific loops. On small vectors, this nets about a 30% speedup. For further speedups, the suggestions are typically to go for loop unrolling, asm, and other heavy-handed solutions that come with a significant development time and code complexity increase.
Of course, readers of this website will know better than to jump straight into the code and apply optimization recipes: they would run the code through a profiler first. And since we’re dealing with a single procedure, an instrumenting profiler would be of little help, so they would run Sampling Profiler instead, and would get to see something like this:
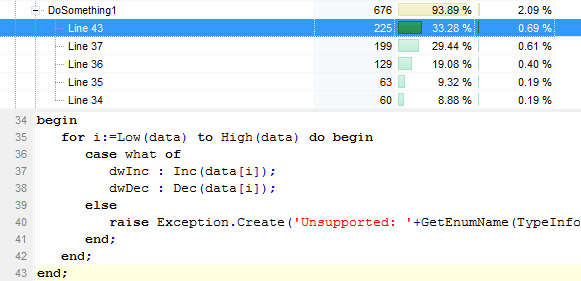
In this run, only the dwInc case was stressed (line 37), and obviously the procedure spends less than 30% of its time doing what it was asked of, and most of its time (33%) on the “end“, ie. cleaning up, plus 8% setting up in “begin“. That’s 40%+ doing nothing but stack and setup/cleanup work!
The conditional in the loop that could have looked like the most worrying bit is eating a bit less than 20% of the time.
What is the source of all that begin/end work? Place a breakpoint on begin, run and hit Ctrl+Alt+C when your breakpoint is reached, go have a look at the CPU view, and you’ll see this:
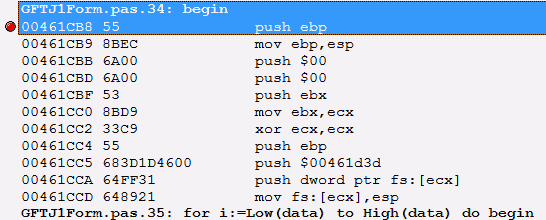
This is a fairly significant stack setup for such a small procedure, and those instructions with “fs:” at the bottom are the setting up of an (implicit) exception frame. An exception frame for what? if you haven’t guessed already, navigate your CPU view near the “end” line.
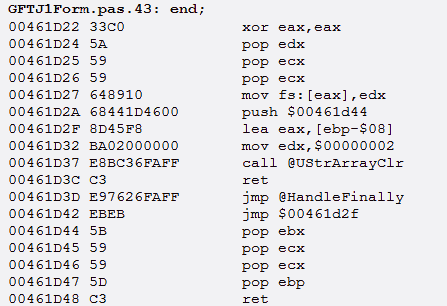
No wonder “end” was a bottleneck! The call to UStrArrayClr indicates that the exception frame is here to cleanup several strings… these strings are those of the raise Exception, one is the string returned by GetEnumName, the other is the result of the concatenation passed to Exception.Create.
Isolate and Kill
How to get rid of that exception frame? One typical way is to use “Exception.CreateFmt”, and pass only constant strings to it, but that is not possible here with the call to GetEnumName, which returns a string. The other way is to isolate the exception to its own (nested) procedure:
procedure RaiseUnsupported(what : TDoWhat);
begin
   raise Exception.Create('Unsupported: '+GetEnumName(TypeInfo(TDoWhat), Integer(what)));
end;
and call RaiseUnsupported in the “case else“. Doing so will move the exception frame to the new procedure, where it’s irrelevant in terms of performance.
This simple change nets us a 33% speedup, ie. we reclaimed most of the lost time in begin/end! We also gained a bit from the UStrArrayClr, which did essentially nothing since those strings it was used to clear weren’t defined (as long as we did not hit the exception).
Note that if you use a nested procedure for RaiseUnsupported, you can be tempted not to pass it the “what” parameter, but use directly the “what” from its parent procedure. However by doing so, you’ll have the compiler use a special stack setup (so that the nested procedure can access the parent procedure’s variables). This setup will be faster than the exception frame it replaces, but with it, begin/end would still be taking about 18% of the CPU time spent in the procedure.
Next: Repeat Until Belly.Full [8]
Previous: Stalking the Prey [6]
Repeat Until Belly.Full;
Those first 33% were easily gained. Let’s go for another round of SamplingProfiler:
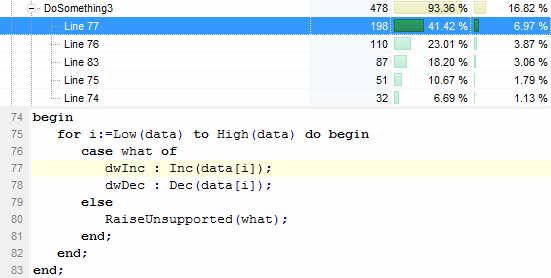
Things are more satisfying: the line performing the actual work is now taking up most of the CPU time. Second comes the case of line. For further speed improvements, we now need to move the conditional out of the loop:
procedure DoSomething3(var data : array of Integer; what : TDoWhat);

   procedure RaiseUnsupported(what : TDoWhat);
   begin
      raise Exception.Create('Unsupported: '+GetEnumName(TypeInfo(TDoWhat), Integer(what)));
   end;

var
   i : Integer;
begin
   case what of
      dwInc :
         for i:=Low(data) to High(data) do
            Inc(data[i]);
      dwDec :
         for i:=Low(data) to High(data) do
            Dec(data[i]);
   else
      RaiseUnsupported(what);
   end;
end;
We have increased the line count noticeably, but most of those extra lines are still cosmetic. What further makes it a reasonable trade-off is that the execution time has been reduced by 66% from the initial version, it now executes 3 times faster!
Are there any more easy gains to be had? Let’s run the last version through SamplingProfiler:
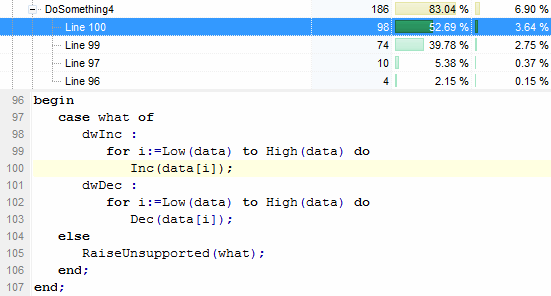
More than 92% of the execution time now goes to the loop and actual work. We got only a wee bit left for stack setup (line 96) and the case of (line 97). At this point, the above makes it clear that if you want to go faster you’ll have to increase the line count and code complexity significantly as you’ll need to replace the two-liner loops with something else, which is bound to be heavier (unrolling, SIMD, etc.)
Previous: Repeat Until Belly.Full [8]
Rest Under A Tree
Some quick final notes to conclude.
When moving an exception to a procedure, there are two things to keep in mind:
- the exception will be triggered at another place in the code, to know where it was actually triggered, you’ll have to look up one step in your exception log stack trace… You do have an exception log stack trace in place, don’t you?
- the compiler won’t “know” about the exception in the called procedure, so it will assume execution continues after your RaiseUnsupported, so you may want to place an Exit after it (which will never be reached), to avoid warnings and allow the occasional register optimization by the compiler.
In the final version, we gained more than the previous profiling run hinted at: the new code allowed the compiler to make better use of the registers. Ofttimes, getting the fat out of the way is all you need to see improvements.
If you check the CPU view, you’ll see everything is quite efficient now, but even then, using all the remaining tricks in the book could probably net noteworthy gains, just at a significant complexity increase. I didn’t try, but I would guess a 2x or 3x speed up should be about right.
If you were to need to go that route, SamplingProfiler could still help you there: on ASM code, you get profiling data down to the ASM instruction… but that’s food for another article.